General Demographics for Veterans
Jefferson County, Colorado
Source: ACS 2017-21 Five-Year National Estimates Veterans Select Demographic Data.
Run New Report
|
Data Reliability About Data
|
Jefferson County, Colorado |
United States |
||||||
| VETERAN POPULATION | Number | Percent | Reliability | Number | Percent | |||
| Total Civilian Population Age 18 or Older Estimate | 466,267 | (X) | 254,296,179 | (X) | ||||
| Veteran Population Age 18 or Older Estimate | 35,043 | 7.5 | 17,431,290 | 6.9 | ||||
| Male Veteran Population Age 18 or Older Estimate | 31,801 | 90.7 | 15,794,025 | 90.6 | ||||
| Female Veteran Population Age 18 or Older Estimate | 3,242 | 9.3 | 1,637,265 | 9.4 | ||||
| AGE | ||||||||
| Veteran Population Age 18 or Older Estimate | 35,043 | (X) | 17,431,290 | (X) | ||||
| Veteran Population Ages 18 to 34 Estimate | 3,085 | 8.8 | 1,508,193 | 8.7 | ||||
| Male Veteran Population Ages 18 to 34 Estimate | 2,673 | 86.6 | 1,236,709 | 82.0 | ||||
| Female Veteran Population Ages 18 to 34 Estimate | 412 | 13.4 | 271,484 | 18.0 | ||||
| Veteran Population Ages 35 to 54 Estimate | 8,109 | 23.1 | 4,151,603 | 23.8 | ||||
| Male Veteran Population Ages 35 to 54 Estimate | 6,757 | 83.3 | 3,508,488 | 84.5 | ||||
| Female Veteran Population Ages 35 to 54 Estimate | 1,352 | 16.7 | 643,115 | 15.5 | ||||
| Veteran Population Ages 55 to 64 Estimate | 6,355 | 18.1 | 3,189,141 | 18.3 | ||||
| Male Veteran Population Ages 55 to 64 Estimate | 5,484 | 86.3 | 2,796,781 | 87.7 | ||||
| Female Veteran Population Ages 55 to 64 Estimate | 871 | 13.7 | 392,360 | 12.3 | ||||
| Veteran Population Ages 65 to 74 Estimate | 9,557 | 27.3 | 4,513,992 | 25.9 | ||||
| Male Veteran Population Ages 65 to 74 Estimate | 9,105 | 95.3 | 4,306,898 | 95.4 | ||||
| Female Veteran Population Ages 65 to 74 Estimate | 452 | 4.7 | 207,094 | 4.6 | ||||
| Veteran Population Ages 75 or Older Estimate | 7,937 | 22.6 | 4,068,361 | 23.3 | ||||
| Male Veteran Population Ages 75 or Older Estimate | 7,782 | 98.0 | 3,945,149 | 97.0 | ||||
| Female Veteran Population Ages 75 or Older Estimate | 155 | 2.0 | 123,212 | 3.0 | ||||
| PERIOD OF SERVICE | ||||||||
| Veteran Population Age 18 or Older Estimate | 35,043 | (X) | 17,431,290 | (X) | ||||
| Veteran Population Age 18 or Older: Served in Gulf War II Estimate | 7,632 | 21.8 | 3,843,757 | 22.1 | ||||
| Veteran Population Age 18 or Older: Served in Gulf War I Estimate | 6,926 | 19.8 | 3,908,610 | 22.4 | ||||
| Veteran Population Age 18 or Older: Served in Vietnam War Estimate | 13,178 | 37.6 | 6,084,415 | 34.9 | ||||
| Veteran Population Age 18 or Older: Served in Korean War Estimate | 2,195 | 6.3 | 1,149,257 | 6.6 | ||||
| Veteran Population Age 18 or Older: Served in WW II Estimate | 617 | 1.8 | 383,739 | 2.2 | ||||
| Veteran Population Age 18 or Older: Served Pre WW II Estimate | 0.0 | 3,926 | 0.0 | |||||
| Veteran Population Age 18 or Older: Did Not Serve During War Estimate | 7,603 | 21.7 | 3,885,010 | 22.3 | ||||
| RACE AND ETHNICITY | ||||||||
| Veteran Population Age 18 or Older Estimate | 35,043 | (X) | 17,431,290 | (X) | ||||
| White Alone-Includes Hispanic Veterans Estimate | 31,045 | 88.6 | 13,825,031 | 79.3 | ||||
| Black Alone-Includes Hispanic Veterans Estimate | 492 | 1.4 | 2,129,670 | 12.2 | ||||
| Native American /Alaska Native Alone-Includes Hispanic Veterans Estimate | 330 | 0.9 | 125,374 | 0.7 | ||||
| Asian Alone-Includes Hispanic Veterans Estimate | 338 | 1.0 | 310,477 | 1.8 | ||||
| Native Hawaiian/Other Pacific Islander Alone-Includes Hispanic Veterans Estimate | 85 | 0.2 | 34,529 | 0.2 | ||||
| Some Other Race Alone-Includes Hispanic Veterans Estimate | 607 | 1.7 | 321,587 | 1.8 | ||||
| Two Plus Races Alone-Includes Hispanic Veterans Estimate | 2,146 | 6.1 | 684,622 | 3.9 | ||||
| White Non-Hispanic Veterans Estimate | 29,684 | 84.7 | 13,119,437 | 75.3 | ||||
| Hispanic Veterans Estimate | 3,329 | 9.5 | 1,336,206 | 7.7 | ||||
| SERVICE-CONNECTED DISABILITY RATING | ||||||||
| Veteran Population Age 18 or Older Estimate | 35,043 | (X) | 17,431,290 | (X) | ||||
| Veterans with Service-Connected Disability Rating Estimate | 7,491 | 21.4 | 4,437,140 | 25.5 | ||||
| POVERTY | ||||||||
| Veterans with Poverty and Disability Status Determined Estimate | 34,565 | (X) | 17,157,125 | (X) | ||||
| Veterans Living Below The Poverty Level Estimate | 1,655 | 4.8 | 1,175,255 | 6.8 | ||||
| DISABILITY | ||||||||
| Veterans with Poverty and Disability Status Determined Estimate | 34,565 | (X) | 17,157,125 | (X) | ||||
| Veterans with a Disability Estimate | 8,386 | 24.3 | 5,059,887 | 29.5 | ||||
| Veterans with a Disability Living Below the Poverty Level Estimate | 772 | 9.2 | 488,736 | 9.7 | ||||
| EMPLOYMENT AND UNEMPLOYMENT | ||||||||
| Veteran Population 18 to 64 in Labor Force Estimate | 14,702 | (X) | 6,809,906 | (X) | ||||
| Veteran Population 18 to 64 in Labor Force Employed Estimate | 14,283 | 97.2 | (X) | (X) | ||||
| Veteran Population 18 to 64 in Labor Force: Unemployed Estimate | 419 | 2.8 | 296,291 | 4.4 | ||||
| Veteran Population 18 to 34 in Labor Force Estimate | 2,615 | (X) | 1,240,602 | (X) | ||||
| Veteran Population 18 to 34 in Labor Force: Employed Estimate | 2,480 | 94.8 | 1,166,284 | 94.0 | ||||
| Veteran Population 18 to 34 in Labor Force: Unemployed Estimate | 135 | 5.2 | 74,318 | 6.0 | ||||
| Veteran Population 35 to 54 in Labor Force | 7,206 | (X) | (X) | (X) | ||||
| Veteran Population 35 to 54 in Labor Force: Employed | 7,009 | 97.3 | (X) | (X) | ||||
| Veteran Population 35 to 54 in Labor Force: Unemployed Estimate | 197 | 2.7 | 137,300 | 3.9 | ||||
| Veteran Population 55 to 64 in Labor Force Estimate | 4,881 | (X) | 2,054,167 | (X) | ||||
| Veteran Population 55 to 64 in Labor Force: Employed Estimate | 4,794 | 98.2 | 1,969,494 | 95.9 | ||||
| Veteran Population 55 to 64 in Labor Force: Unemployed Estimate | 87 | 1.8 | 84,673 | 4.1 | ||||
| EDUCATION | ||||||||
| Veteran Population Age 25 or Older Estimate | 34,482 | (X) | 17,199,716 | (X) | ||||
| Veteran Population Age 25 or Older: Less Than High School Graduate Estimate | 900 | 2.6 | 902,424 | 5.2 | ||||
| Veteran Population Age 25 or Older: High School Graduate Estimate | 6,372 | 18.5 | 4,728,547 | 27.5 | ||||
| Veteran Population Age 25 or Older: Some College and AA Degree, Less Than BA Degree Estimate | 12,546 | 36.4 | 6,413,978 | 37.3 | ||||
| Veteran Population Age 25 or Older: BA Degree or More Estimate | 14,664 | 42.5 | 5,154,767 | 30.0 | ||||
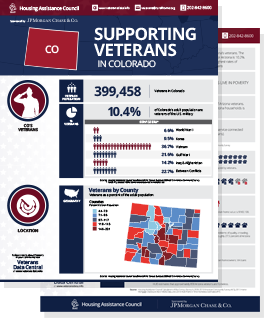
State Profile: Colorado (CO)
View another State Profile:
Nearly 8 in 10 veterans are homeowners
Approximately 11.1 million (9.0%) of U.S. homes are occupied by veterans